How I may help
LinkedIn Profile Email me!
Call me using Skype client on your machine


Reload this page LoadRunner Architecture (www.LoadRunner.Info)

http://bit.ly/loadrunner

Here are concise notes on using LoadRunner for performance testing. This is a companion to my pages on Vu Scripting, performance monitoring, performance tuning, and reporting.

As of November 28, 2007, the URL A website external to this site LoadRunner.com redirects you to HP's Performance Center product page. The URL for Mercury.com is redirected to HP's BTO page. HP BTO Training is now at merc-training.com - 877-837-8457.


Topics this page:

  • Summary
  • Virtual Users
  • Product Versions
  • Sys. Components
  • Install & Config.
  • LR Architecture
  • Agents & Monitors
  • VuGen Recording
  • Controller Scenarios
  • Protocols
  • Trans. Response Times
  • Measurement Calcs
  • Measures of Variation
  • Analysis Module
  • User Hangouts
  • RPM
  • Your comments???
  •  

    RSS XML feed for load testers RSS preview for load testers Site Map List all pages on this site 
    About this site About this site 
    Go to first topic Go to Bottom of this page


    “The new configuration is stable.” by Star Trek Voyager's Tuvok (actor Tim Russ)

    Doubt is not a pleasant condition, but certainty is absurd. —Voltaire

    Scripts Run-time Settings VuGen Capture and Record Java Clients IE Clients Client Emulation Server/Environment Under Test LoadRunner Controller LoadRunner Analysis Scenarios Schedules Reports and Graphs Microsoft Word Internet browser Microsoft Excel Microsoft Access Crystal Reports Mercury Diagnostic Probes Load Generators Analysis Logs Monitors Run Result Logs


    Set screen Architecture Overview

      LoadRunner works by creating virtual users who take the place of real users operating client software, such as Internet Exploreranother page on this site sending requests using the HTTP protocol to IIS or Apache web servers.

      Requests from many virtual user clients are generated by "Load Generators" in order to create a load on various servers under teston this page

      These load generator agents are started and stopped by the "Controller" program.

      The Controller controls load test runs based on "Scenarios" invoking compiled "Scripts" and associated "Run-time Settings".

      Scripts are crafted using the "Virtual user script Generator" (named "V U Gen"), It generates C-language script code to be executed by virtual users by capturing network traffic between Internet application clients and servers.

      With Java clients, VuGen captures calls by hooking within the client JVM.

      During runs, the status of each machine is monitored by the Controller.

      At the end of each run, the Controller combines its monitoring logs with logs obtained from load generators, and makes them available to the "Analysis" program, which can then create run result reports and graphs for Microsoft Word, Crystal Reports, or an HTML webpage browser.

      Each HTML report page generated by Analysis includes a link to results in a text file which Microsoft Excel can open to perform additional analysis.

      Errors during each run are stored in a database which can be readanother page on this site using Microsoft Accessanother page on this site


    Go to Top of this page.
    Previous topic this page
    Next topic this page

    Set screen Virtual Users (Vusers)

      Unlike a WinRunneranother page on this site workstation which emulates a single user's use of a client, LoadRunner can emulate thousands of Virtual Users.

      Load generators are controlled by VuGen scripts which issue non-GUI API calls using the same protocols as the client under test. But WinRunner GUI Vusers emulate keystrokes, mouse clicks, and other User Interface actions on the client being tested Only one GUI user can run from a machine unless LoadRunner Terminal Services Manager manages remote machines with Terminal Server Agent enabled and logged into a Terminal Services Client session.

      During run-time, threaded vusers share a common memory pool. So threading supports more Vusers per load generator.

      The Status of Vusers on all load generators start from "Running", then go to "Ready" after going through the init section of the script. Vusers are "Finished" in passed or failed end status. Vusers are automatically "Stopped" when the Load Generator is overloaded.

      No additional license is needed to monitor standard web (HTTP) servers (Apache, IIS, and Netscape).

      To use Web Services Monitors for SOAP and XML, a separate license is needed, and vUsers require the Web Services add-in installed with Mercury Feature Pack (FP1)


    Go to Top of this page.
    Previous topic this page
    Next topic this page

    Set screen Product Versions

      Version 9.51 patch to 9.50 (file KM750376 file LR_03009.zip, dated July 6, 2009, is a 201 MB zip. enables better AJAX recognition and specification of DOM element properties. This runs GACSetup.exe and Magentconfig.exe, which require Vista users to allow.

      Version 9.50 available June 2009,

      Version 9.10 installer, available Feb. 2008, is 2.31 GB after expansion. However, the folder created after an English language install is 931MB.

      Version 8.1 Feature Pack 4 patch installer LR81FP4P136.exe at 7,786,800 bytes, was signed on January 2, 2007 as file 8.1.4.0 (Build: 1735) is Recorder Version: 1290.

      Version 8.1 Feature Pack 4 installer LR81FP4.exe, at 194,644,720 bytes, was signed on December 15, 2006 as file version 8.1.4.0 (Build: 2249) is Recorder Version: 1289. This requires an upgrade to MS.NET 2.0 clients.

      Version 8.1 Feature Pack 3 installer LR81FP3.exe, at 116,601,240 bytes, was signed on June 18, 2006 as file version 8.1.3.0 (Build 2085). It installs (as an item on your Start > Program Files) Microsoft WSE (Web Services Enhancements) 2.0 SP3 to deploy security policies for sytems running .NET Framework 1.1.

      Version 8.1 became available October 2005. In VuGen it adds a "Workflow View", "Workflow Wizard", and a memory leak which is fixed with a patch downloadable since Dec. 2005. It renames the VuGen "Execution Log" the "Replay Log".

      Version 8.0 became available August 2004. It adds "Additional Attributes" to Runtime Settings. It also adds (for additional fee) diagnostics and tuning capabilities, allowing Transaction Breakdown to breakdown transaction times across different servers servicing various transaction layers (web server, Oracle 11i & Peoplesoft 8 app server, database) layers. It separates SQL time in execute, parse, and fetch times.

      Version 7.8 Feature Pack 1 added support for Windows XP.

      Version 7.8 became available September 2003.

      Version 6.5 available June 2000 offered new "TurboLoad" technology -- a completely new replay engine that runs thousands of vusers using a single operating system thread.

      Version 6.0 used a separate thread per user, which required almost 10 times more i/o and CPU cycles than 6.5.


    Note: Links to documents that used to be here were removed after Mercury Interactive, Inc. lawyers demanded their removal. Page numbers in online pdf files are different (have more pages) than page numbers in the paper document of the same title.

    Although version 9.10 is now installed under "HP", "Mercury" remains under Program Files\Common Files, its \TDAPI\Client folder contains files TDCIntui.dll and tdclient.dll.

    These, the hidden folder C:\Config.Msi, the MacroVision folder (within Documents and Settings\All Users.WINDWS\Application Data), and many other files remain after uninstall.

    Over three thousand entries also remain within the Windows Registry after uninstall.

     
    Go to Top of this page.
    Previous topic this page
    Next topic this page

    Set screen Application Components' Requirements

      Loadrunner makes use of four executables with different webpage article system requirements

      Application
      Product
      Process
      Image Name
      Process KB File
      Size
      V9.51 V9.0 V8.0
      Launcher LRLauncherApp.exe - 15,840 16,288 n/a
      Vugen Virtual User Generatoron this page VuGen.exe 36,024 23,980 12,436 2,334,769
      Controller Controlleron this page with On-Line Monitors wlrun.exe - 61,312 13,076 5,681,215
      Load Generator Agenton this page magentproc.exe 2,684 3,336 3,236  
      magentservice.exe - 3,496   65,536
      mdrv.exe -    
      Analysis Analysison this page Analysisui.exe 26,768 64,460 13,132 6,058,496
      Tuning Consoleon this page protune.exe - -   3,403,833

      Console programs

      perl5.8.0.exe Interpreter 20,535
      regtlb.exe registers the batch automation type library 30,720
      sed.exe GNU sed (gsed) version 2.05 55,296
      wdiff.exe Compares text files 197,632

      Alex Arbitman's MS Excel spreadsheetLR 7.8 Footprints.xls reports that to run Web requires __ per process and __ per thread.


    Go to Top of this page.
    Previous topic this page
    Next topic this page

    Set screen Using Windows Remote Desktop Connection

      Caution! Remote Desktop Connection (part of the Terminal Services that comes with Winodows XP) is not as reliable with LoadRunner as Remote Administrator.

      To keep Windows Remote Desktop Connection sessions from timing out during a test, the Terminal Services on each machine should be configured as follows:

      1. Click Start, point to Programs (or Control Panel), Administrative Tools and choose Terminal Services Configuration.
      2. Open the Connections folder in tree by clicking it once.
      3. Right-click RDP-Tcp and select Properties.
      4. Click the Sessions tab.
      5. Make sure "Override user settings" is checked.
      6. Set Idle session limit to the maximum of 2 days instead of the default 2 hours.
      7. Click Apply.
      8. Click OK to confirm message "Configuration changes have been made to the system registry; however, the user session now active on the RDP-Tcp connection will not be changed."

      Caution! Make sure that when you do this you're not violating one of your corporation's security policies.

      Caution! Terminal Server only allows two simultaneous connections. To disconnect from a session, do not click "X" on the remote desktop window but click Start and Log Off.


    Go to Top of this page.
    Previous topic this page
    Next topic this page
     
    HP's LoadRunner Support is part of OpenView Support.
    Among common problems installing LoadRunner: Windows 2003 & XP SP2 have a DEP (Data Execution Prevention) feature which prevents VuGen recording. Go to Control Panel, System -> Advanced tab, Performance section "Settings" button Data Execution Prevention tab and add the client program or choose "Turn on DEP for essential windows programs and services only." A reboot is required.

    Set screen LR Installation and Configuration

      Download [after required registration] the trial from the HP Download Center.

      Idea I recommend that you put downloaded LoadRunner installation files and patches to a separate media such as a CD or USB drive. Then mark those files as read-only.

      Disable your anti-virus software (Symantec, McAfee, etc.) before invoking on installers.

      If you are running with an Intel chip, disable Intel Hyper-Threading technology by shutting down and entering BIOS. Microsoft's information on this.

      Caution Virus Detection engines may find that program regtlb.exe (which registers/unregisters type libraries) to contain a "virus" they call "Backdoor.Win32.PoeBot.15872". Automatic repair by the virus remover will break those files

      To avoid LR 9.x VuGen recording problems on Windows XP SP2 and Windows 2003, open Start > Control Panel > System, Advanced tab, click Performance settings. In the Performance Options Data Execution Prevention tab, select "DEP for essential services only", then reboot the machine.

      The LR box comes with two CD's and this installation manual. Separate installation manuals are available for the Controller and Analysis modules.

      The Windows CD autostarts to this initial screen for v7.8 screen captured and this initial screen for v8.0 screen captured

        You can install just a single component (such as VuGen) by (ironically) selecting "Full install" and then the "Custom" option to check the specific components to install. However,
        Caution! due to a strange bug with v8.0, before you do that, first install the Load Generator, then return to install "custom" components.

      The UNIX CD installs only the Load Generator (not the Controller or VuGen) on UNIX machines because the Controller and VuGen only run on Windows machines.

      Idea Zero fill machine names to t001, ... t010, etc. The LR Controller sorts machines named t1, t2, ... t10 as t1, t10, t2.

      Set screen Location of Program Files

      The LoadRunner installation program adds files in Program Files, Windows folder, and the Windows Registryanother page on this site that are NOT removed during un-installation.

      If you get a "License violation" message, you need to get from HP support a one-day license key to install with.

      Program Files (x86) is the default folder if you install LoadRunner on a 64 bit machine.

      Different versions of LoadRunner are installed to different locations:

        LoadRunner 9.1 and 9.5 executable files are installed to file path
        "C:\Program Files\HP\LoadRunner\bin"

        LoadRunner 8.1 and 9.0 executable files are installed to file path
        "C:\Program Files\Mercury\LoadRunner\bin"

        LoadRunner 8.0 "stutters" when it installs to its default file path
        "C:\Program Files\Mercury Interactive\Mercury LoadRunner\bin"

        Note: Even though 8.0 uses a different folder, folders created by previous versions still need to be removed before its installation.

        LoadRunner 7.8 executable files are installed to file path
        "C:\Program Files\Mercury Interactive\LoadRunner\bin"

      When working with Java, instead of overridding these default installation folder to a path without spaces (such as C:\LR78) , just use the equivalent DOS 8.3 file names:

      Idea To quickly get at this LoadRunner installation folder, create an environment variableanother page on this site named "LR91" so you can use a quick command such as

         cd %lr81%
        

      To get at this folder quickly, I created a batch file named "L.bat" in the cmd's default C:\ root folder containing this:

        cd \Program Files\HP\LoadRunner\bin
        
        pause

        I created a shortcut to this file on my desktop and dragged it over Windows so that I can click into that folder from anywhere. The pause command ensures that the command window does not disappear automatically. Alternately, from within a command window I can just type "L" and press Enter.

      Set screen Files in Windows Folders

    1. This path specified is stored under [ProductEnv] as M_ROOT in file wlrun.ini. This file was in the C:\WINNT (or C:\Windows) folder until v9.10, when it moved within the LR Config folder.

      The C:\WINNT (or C:\Windows) folder also holds the Maintenance Number (MPN) specified during installation, stored as a parameter named "LoadRunner_SerialNumber" (such as 1234-1234567890) in the mercury.ini file.

      Set screen Start Menu

      Since LR 9.0, installers added links to the most used programs in

        > Programs > LoadRunner

      Before that, LR installers added links to the most used programs in

        > Programs > LoadRunner

      However, some programs are installed which are not conveniently listed there, such as
      tool WDiff.exe v1.49 to compare differences between two ASCII text files. It has an accompanying help file

      Beginning with v7, LoadRunner prevents software piracy (much like Microsoft began doing with Windows XP) by requiring that a license key be provided within 10 days of installation. LoadRunner generates its license key based on a host ID generated on each computer.

      With v7.x, to generate Generate a HostID key (such as "XCCWJU-APBE-BYDS") click down

        Programs > HP > LoadRunner > License tab

        The key can be obtained before installation from program licidgenerator.exe and (after registration) its lm70.dll from the installation CD folder \lrunner\lm70.nt\bin or \lrunner\setup\lm70.nt\bin.

      Set screen Sample Apps / Protocols

      To run the samples install program, Copy the link location below into the "Program to record:" field:

      Protocol Server Client Program Parameter Notes
      Web WebTours\StartServer.bat http://localhost:1080/mercuryWebTours  
      COM/DCOM (Operating System) samples\bin\frsui.exe  
      Winsock sockfrs.exe samples\bin\flights.exe Winsock
      WinSockWeb
      ODBCanother page on this site (MS Access) samples\bin\flights.exe ODBC_Access
      CORBA samples\CorbaSamples\server.cmd &
      samples\CorbaSamples\server.bat
      samples\CorbaSamples\client.cmd &
      samples\Corbasamples\clientrecord.cmd
        Stuart Moncrieff's article on CORBAA website external to this site
      RMI samples\RMISamples\server.cmd &
      samples\RMISamples\server.bat
      samples\RMISamples\client.cmd &
      samples\RMISamples\clientrecord.cmd
       

      According to CPT11877.doc, JDK 1.5 users need to contact Mercury Support for a patch to each specific LoadRunner version (7.6, 7.8 FP1 or 8.0). Otherwise, you'll get these messages:

        Error: Failed to find javac.exe Java Compiler in Path and JDK installation folder in registry. [MsgId: MERR-22981]
        Error: Failed to compile the Actions.java file. Please add the \bin to the path and try again. [MsgId: MERR-22996]
        Warning: Extension java_int.dll reports error -1 on call to function ExtPerProcessInitialize [MsgId: MWAR-10485]
        Error: Thread Context: Call to service of the driver failed, reason - thread context wasn't initialized on this thread. [MsgId: MERR-10176]

      The Java sample apps use the "flight32lr" User Data Source with Microsoft Access driver(*.mdb) in the USER DNS table in Data Sources(ODBC) of the VuGen's local machine.

      Additionally, the sample Java servers must be operational prior to starting the client. This is done with the "samples\RMISamples\server.cmd":

        set lrpath=C:\PROGRA~1\Java\jre1.5.0_02\bin;C:\PROGRA~1\MERCUR~1\MERCUR~1\classes
        set lrclasspath=C:\PROGRA~1\MERCUR~1\MERCUR~1\classes;C:\PROGRA~1\MERCUR~1\MERCUR~1\classes\srv;C:\PROGRA~1\Java\jre1.5.0_02\lib\rt.jar
        set flightRmi=%~dp0;%~dp0RmiSamples.zip
        set classpath=%lrclasspath%;%flightRmi%;C:\PROGRA~1\Java\lib\rt.jar;.;%classpath%
        set path=%lrpath%;.;%path%

        cd %~dp0
        start java -Djava.security.policy="%~dp0RmiFlights.policy" RmiFlights.Server

        Idea Note the location of loadrunner class files I added to the default sample. They are pre-pended to the existing classpath.

        Note that there are no spaces in the file path.

        Reminder The Zip file is equivalent to a JAR file in Unix systems.

        Caution! Do not delete the black command window because the Java server runs within it.

      CORBA and RMI Java clients are invoked with a command for Windows to start the java.exe program. This "samples\RMISamples\client.cmd" file contains:

        set lrpath=C:\PROGRA~1\Java\jdk1.5.0_02\bin;C:\PROGRA~1\MERCUR~1\MERCUR~1\classes
        set lrclasspath=C:\PROGRA~1\MERCUR~1\MERCUR~1\classes;C:\PROGRA~1\MERCUR~1\MERCUR~1\classes\srv;C:\PROGRA~1\Java\jdk1.5.0_02\lib\rt.jar
        set flightRmi=%~dp0;%~dp0RmiSamples.zip
        set classpath=%lrclasspath%;%flightRmi%;C:\PROGRA~1\Java\jdk1.5.0_02\lib\rt.jar;.;%classpath%
        set path=%lrpath%;.;%path%

        cd %~dp0

        start java RmiFlights.main

        Note that the RmiFlights.main class file name is passed into java for it to load.

      When recording Java with VuGen, a different command — such as the sample clientRecord.cmd — needs to be invoked because VuGen needs to be invoked within the JVM sandbox:

        set flightRmi=%~dp0;%~dp0RmiSamples.zip
        set classpath=%flightRmi%;%classpath%
        cd %~dp0

        start InvokeVugen.exe

      Caution! The location of the JDK needs to be specified in the Windows PATH environment variable PATHanother page on this site to avoid this message:

        Error: Failed to find javac.exe Java Compiler in Path and JDK installation folder in registry. [MsgId: MERR-22981]

      Reminder VuGen "Java Vusers" can only operate as Single Vuser mode (not multi-vuser).

      Instead of web "Start recording", Java VuGen scripts invoke Java functions within the Actions section.
      "vuser_init" and "vuser_end" actions are not relevant within Java VuScripts.

      Internally, the cjhook.ini file specifies which Java classes can hook in its [EXC_SYSTEM_CL] section. Java classes specified in the [SYSTEM_CL] section are not hooked.

      The user.hooks file in LR \bin folder is a general format and cannot be used as-in. It needs to be copied.

      Uninstall

      Caution! To uninstall LoadRunner, you must be logged in with the same Windows userID as was used during original installation! If you use a different userid, the uninstall will delete only the dat folder which contains the "miuninst" file.

      Unlike Microsoft Office applications, LoadRunner has not been programmed so individual components to be selectively uninstalled.


    Go to Top of this page.
    Previous topic this page
    Next topic this page

    Set screen LoadRunner Internal Architecture


    Go to Top of this page.
    Previous topic this page
    Next topic this page
    Set screen
    1. application serverson this page under test are placed under stress by
    2. driver processes mdrv.exe (the Multi-threaded Driver Process) and r3vuser.exe which emulate application clients such as Internet Explorer web brower. It performs 3 main actions:
        Kli> cpp (C language pre-processor)
      1. cci (C pre-compiling) which creaes a file with ci file, and
      2. execute using the driver for the protocol technology being tested.

      Runs can be invoked to run "silently" by invoking Mdrv.exe from a Windows batch script.

      Mdrv can automatically stop loading Vusers because they communicate with Vusers and monitor CPU usage on Windows Load Generator machines.

      A separate JVM is instantiated by each Java-based Vuser on Windows-based machines. #Java Vusers are not supported on Unix platforms.

    3. virtual Vusers are invoked as groups (logical collection of virtual users running the same script on a specific load generator machine)
    4. by agents (3,900K magentproc.exe) running as a service or as a processon this page
    5. on load generator client machines.

    6. Each machine hosting agents maintains an Execution Log in a .qtp file.
    7. When logging is enabled, the agent also creates within the results folder a sequential log file for each Vuser (segregated by Vuser group).
    8. During execution, this file is displayed in the view > Show Output window on the LoadRunner Controller machine.

    9. Upon a pre-set delay, the Scheduler running on a Controller machine instructs agents (via Windows port 54345 or dynamic Unix port) to initiate test session scenarios. The Controller (wlrun.exe) sends a copy of scenario files along with the request.
    10. Agents are launched by the Remote Agent Dispatcher process (formerly called Remote Command Launcher (RCL)) on each load generator machine.
    11. Each agent refer to scenario (.lrs) definition files to determine which Vuser groups and scripts to run on host machines.

      Idea This means the Controller can be started from a DOS batch (.bat) file (preferrably with a short name on a root drive):

        REM Start Controller:
        SET M_ROOT=C:\Program Files\HP\LoadRunner\bin
        cd %M_ROOT%
        wlrun.exe -TestPath D:\Dev\Dev1.lrs -port 8080 -Run -DontClose
        pause Press Ctrl-Z to keep this window or

      • Including the -Run parameter is the same as manually pressing the "Start Scenario" automatically upon invocation. This is not a good idea because you may have to decide about collating the file from a previous run or want to change the output folder.
      • This assumes that the system's environment PATH variableanother page on this site was updated to include where LoadRunner is installed.


    Go to Top of this page.
    Previous topic this page
    Next topic this page
    Set screen
    1. The Controller is invoked using parameter values within files in the Windows OS folder (WINNT for Windows 2000 and WINDOWS for Windows XP). The Windows folder is used because LoadRunner is designed to have only one instance of Controller running at a time on a machine.

        Idea To quickly switch among several applications, save a copy of LoadRunner's ini files after working on it within the Controller, then use Notepad to craft a batch fileanother page on this site to copy application-specific versions of ini files before executing wlrun. An example of file copy actions for application XXX:

          copy %LRDir%/config/wlrun7-XXX.ini   %LRDir%/wlrun7.ini
          copy %LRDir%/config/wlrun7-XXX.dft   %LRDir%/wlrun7.dft

        Prior to v9.0:

          copy %WinDir%/wlrun7-XXX.ini   %WinDir%/wlrun7.ini
          copy %WinDir%/wlrun7-XXX.dft   %WinDir%/wlrun7.dft

      Some defaults you might want to change:

      • In the wlrun7.ini file file [output] section, MaxNumberOfOutputMessages= from 10000 to 100000 for long runs. This limits the number of output messages stored in the database.
      • MaxOutputUIRowsToShow limits the amount of messages/errors (lines) displayed in the Controller's Output window.
      • In the QTWeb.lrp file within the LoadRunner Program Files dat\protocols folder section [Vugen], add entry MaxThreadPerProcess=5 to limit the number of threads managed by each load generator mdrv.exe process.

      Values for DefaultScenarioDir, DefaultScriptDir, DefaultResultDir, and [Recent File List] stored in the wlrun5.ini and wlrun7.dft files updated whenever values are changed within the Controller.

    2. The blocks of actions taken by each Vuser are
    3. defined in Vu scriptsanother page on this site created using Loadrunner's VuGen.exe. When this program is invoked, it stores in the Windows folder a comparamui.INI file to save under "[LastTablesUsed]" a history of files and [ParamDialogDates] specified using menu option Insert > New Parameter > Dates.

      VuGen stores and retrieves a vugen.ini file in the Windows folder. When using Java, enable additional debug options:

        [DynaDlg]
        JavaLevel=3

      When using 8.0 scripts within VuGen 8.1, add to Vugen.ini:

        [Editor]
        OLDEDITOR = 1

      VuGen opens in LR folder template/qtweb default.cfg and script files.

      Vu scripts can be coded to use variable values obtained from parameter files external to the script.

      I have a lot more on VuGenanother page on this site here

    4. During a run, execution results are stored to a results folder.
        Idea I prefer to set Results Settings to "Automatically create a results directory for each scenario execution." which means that LR will increment the name of the Results Name when I start a scenario runs. For example, a value of "Res11" will be automatically incremented to "Res12" or sometimes "Res11-1".

      Errors are written to the output.mdb MS Access database. tool See the ASP page I have written to access this databaseanother page on this site

    5. Within each results folder, a "Log" folder is automatically created to contain a log file for each group. After a run, to view a log file from within the Controller, click Vusers button then right-click on a group to select "Show Vuser Log".

    6. As a scenario is run, monitors maintain counters locally on each host.

    7. After a run, the "collate" process takes .eve and .lrr result files and creates in the results folder a temporary .mdb (MS-Accessanother page on this site) database.

      To prevent errors when processing large result files, use MSDE (Microsoft SQL Desktop Engine).

        setup SAPWD="StrongPassword" INSTANCENAME="LR" SECURITYMODE=SQL DISABLENETWORKPROTOCOLS=0 /L*v path to log file

      Using Windows Explorer, share the Data folder.
      Then in Analysis Options > Database tab, use 8.3 names without spaces (indentified with DOS command DIR /X):

      1. Input the SAPWD password specified above.
      2. Logical Storage location: \\loadclient02\Data (the folder you shared)
      3. Physical Storage Location: C:\PROGRA~1\MICROS~1\MSSQL\Data (not C:\Program Files\Microsoft SQL Server\MSSQL\Data)
      4. Click "Test parameters". (This takes a few seconds)

    8. The Analysis Module (8,320K analysisu.exe)
    9. generates analysis graphs and reports using data from the .mdb database.
    10. The LoadRunner Results file results_name.lrr from each scenario run -- also called an Analysis document file -- is read by the Analysis program to display Percentile graphs.
    11. By default, the LRReport folder is created in the test analyst's local machine My Documents folder to store Analysis Session files.
    12. They can optionally be formated in HTML.
    13. Their format are controlled by a .tem template file.

    14. Optionally, Mercury's Remote Performance Monitoring (RPM) MS-IIS/ASP web server for LoadRunner 7.8 can be installed on a Windows 2000 server (Caution! but not on a Windows 2003 server) so that
    15. load test results to be viewed using a web browser.

      Not pictured is the LoadRunner Tuning Module (a separate $50,000 product). Mercury's "Get Ready" white paper


    Go to Top of this page.
    Previous topic this page
    Previous topic this page

    Set screen Load Generator Agent Process vs. Service

      During installation, at the screen captured User Login Settings screen:

      • selecting "Allow virtual users to run on this machine without user login" means the LoadRunner agent will be run as a SYSTEM service named "LoadRunner Agent Service". From within Window's Perfmon, this image is named magentservice.exe.

        Idea For better security, specify a separate service account userid and password so that permissions for it can be limited.

        After installation, to tell if it's running , bring up the Windows Services list:


          On Windows 2000, go to Start -> Control Panel -> Administrative Tools -> Services.
          On Windows NT4, go to Start -> Control Panel -> Services

        You also need to enter the Services list to change the password or to unset the service as "Automatic".

      • selecting "Manual log in to the Load Generator " means the LoadRunner agent will be run as a process named magenproc.exe. This approach means you need to invoke the Load Generator from LoadRunner's \launch_service\bin folder every time you boot-up that machine:

          magentproc.exe

        You can tell it's running by the "satellite dish" icon in the Windows task bar at the lower right corner of your screen.

        Idea To get the Agent to start up automatically after reboot, create a shortcut to it in the Programs\Startup folder.

      Reminder As a process, the Windows operating system constrains the agent service from running GUI (WinRunner, QuickTest Professional, etc.) or GUI-like scripts (Citrix, SAPGUI, etc.). Therefore, GUI and SAP Vusers cannot run if the Remote Agent Dispatcher is installed on the Load Generator machine as a service rather than as a process.

      After installation, to switch from running LoadRunner as a service to running as a process:

      To install LoadRunner as a service:

        magentservice.exe -install

      These commands do not result in response messages. But they do put the m_agent_attribs.cfg file in the load generator's C:\ root folder.

      If you do not have Administrator rights and try to change the UserID: Admin and Password: Admin, you will see message ERROR: "29972:- Failed to reset launcher status call back function reason:no monikor was passed.

      On a UNIX machine, the agent is configured by editing the br_Inch_server.cfg file in the dat folder under the LoadRunner root folder.

      Confirm & Ensure Agent Readiness

      At the Controller's Load Generators dialog, you should see "Ready" (for the agent you highlighted) after you click the "Connect" button.

      Repeat these commands if you get message "Failed to connect to the agent. Load Generator not responding after timout Command line that was executed:"

      If this still doesn't result in "Ready" Status, go to Windows Services on the load generator client machine and kill, then remove the "LoadRunner Agent Service" before repeating the above commands.

      Set FireWallServiceActive to 1 for true or 0 for false. Run bin/agent_config

      Using network drive mappings

      If several load generators need to access the same physical files, rather than having to remember to copy the files each time they change, each load generator can reference a common folder using a mapped drive. But since drive mappings are associated with a specific user:

      1. Logon the load generator as the user the load generator will use
      2. Open Windows Explorer and under Tools select Map a Network Drive and create a drive.
        Idea It saves time and hassle to have consistent drive letters across load generators, so some organizations reserver certain drive letters for specific locations.
      3. Open the LoadRunner service within Services (accessed from Control Panel, Administrative Tasks),
      4. Click the "Login" tab.
      5. Specify the username and password the load generator service will use. (A dot appears in front of the username if the userid is for the local domain).
      6. Stop and start the service again.


    Go to Top of this page.
    Previous topic this page
    Next topic this page

    Set screen Controlling Load Generators and Monitoring Through a Firewall

      The purpose of a firewall is to increase security by blocking communications and allowing communications only certain ports, such as 80 and 443 for HTTP and HTTPS traffic.

      By default, the LoadRunner Controller uses TCP port 50500 to send data to TCP port 54345 on the Windows Load Generator.

      The Load Generator sends information back via a dynamic port. through the MI Listener.

      To avoid having to beg Network Administrators for more ports to be opened, on each load generator machine inside the firewall, from Start > Programs > ... LoadRunner > Advanced Settings > Agent Configuration (launch_service\bin\AgentConfig.exe) install the (Monitoring Over Firewall machine) MoFW/RoWF agent. Check the option "Enable Firewall Agent".

      It collects performance counters and sends them to a controller over a firewall.

      LoadRunner 7.8 automates what LoadRunner 7.6 and earlier versions required you to go into "Agent Settings" to change the mdrv.dat file within the dat folder where LoadRunner is installed. The [FireWall] section should be changed to contain "FireWallServiceActive=1". This should cause the tiny stoplight to turn green in the agent icon on the toolbar.

      br_lnch_server.cfg

      MoFW communicates with the MI Listener through port 443, so you can't have any web servers (like Apache WebTours, IIS, or Oracle HTTP servers) running on both the machines.

      Verify whether port 443 actually allows communication by running command and substituting the ip address in:

        telnet   194.194.194.194   443

        This should open a telnet window.

      UNIX Load Generator uses a dynamic port that cannot be fixed.

      When defining a "remote" load generator from within the Controller, click "Details" for the "Load Generator Information" dialog, where you can click the "Firewall" tab and check "Enable Firewall".


    Go to Top of this page.
    Previous topic this page
    Next topic this page

    Set screen Monitors on Windows & UNIX/Linux

      Monitoring UNIX Machines

      Reminder Before starting a run on Linux, check to make sure that rstatd monitors are active. If rstatd services are dropped when a server becomes too busy or is restarted, LoadRunner 7.8 does not attempt to re-acquire information from rstatd. The work-around is to exit and reinitialize the Controller again.

      MI Listener for HTTPS/SSL Traffic

      When agents send HTTPS traffic (through port 443) from behind a firewall, it uses the "Monitoring over Firewall Component" and the Controller communicates uses a symbolic name for the agent through the MI Listener Machine (through port 50500) outside the firewall. Monitoring of Windows machines through a firewall use TCP port 139.

      To test outside the firewall mercuryinteractive.com/products/protune_ds/ Mercury ProTune Delivery Service


    Go to Top of this page.
    Previous topic this page
    Next topic this page

    Set screen VuGen Recording & Scripting

      Where Did The Screen Go?

      VuGen remembers the screen coordinates you were when you last close VuGen. The bad thing about this is that if you use a second monitor to extend your screen and disconnect it to use a single monitor, nothing will appear on that one screen because VuGen still thinks you have that extended screen. The solution is to edit the vugen.ini file within the config folder where LoadRunner is installed, search for x=, then change entries x=-9 and y=-9. Also, Maximized=1 specifies VuGen to be maximized.

      LoadRunner script code is usually obtained from recording in ANSI C language syntax, represented by icons in icon view until you click Script View.

      DotNet Patch

      LR 9.0 installs .NET 3.5.

      With LR 7.9, before recording against applications running within Microsoft's .NET Frameworkanother page on this site \ runtime on Window XP platform using LoadRunner7.8:

      1. Back up trpfnc32.dll in the LoadRunner\bin directory.
      2. On the LoadRunner 7.8 CD, navigate to the \Patches\Trap_for_.net_patch folder.
      3. Copy trpfnc32.dll to the LoadRunner\bin directory.

      File Locations

      Idea I recommend that you store all files to a drive letter you created (by mapping to a folder). This makes it easier to override LoadRunner's defaults initially and also easier to remain consistent when you change machines and drives over time, especially when several testers use LoadRunner.

      By default, .htm and resource files captured during a script's development are stored in a data folder created for each script under the scripts folder within Program Files.

      Each script's run-time settings are stored in that script's .cfg file within each Vuser script's directory for use by both VuGen.exe and the LR Controller.

      VuGen stores and retrieves Windows Registry HKEY_LOCAL_MACHINE \SOFTWARE \Mercury Interactive \LoadRunner key RecentScripts every script.

      VuGen also stores and retrieves Windows Registry key Test Results \ Recent File List the location of every .qtp file generated.

      The maximum number of scripts displayed in the Available Scripts list is stored in Registry key HKEY_CURRENT_USER \ Software \ Mercury Interactive \ RecentScripts \ max_num_of_scripts

      Each Vuser can apply a different weighting to iterate some action files more frequently than others.

      Set screen Data File Locations

      Idea By default, data files (containing URLs, userids, etc.) created within a script reside in that script's folder. I like leaving it there rather than moving it to the common root shared by all scripts because VuGen automatically copies those files when you save or import a script. Plus, changing the data structure of a common file disables previous versions of the script.

      Idea I like random access to data files because it's a easy way to test multiple values from within VuGen — I just run the script again. However, since VuGen always uses the first value when Sequential access is specified, to exercise multiple values I have to either change the data file or run the script again within the Controller.


    Go to Top of this page.
    Previous topic this page
    Next topic this page

      Set screen Browsers

      Browser Type Browser Version Platform
      Microsoft Internet Explorer 7.0, 6.0, 5.5, 5.01, 5.0, 4.0 HP-UX, Unix, SunOS, Win32, Windows, WinNT, WinXP
      Mozilla Firefox 1.5.0.6, 1.5.0.4, 1.5, 1.0.7, 1.0.6, 1.0
      Netscape Navigator 6.2, 6.0, 4.76, 4.6, 4.5, 4.0


    Go to Top of this page.
    Previous topic this page
    Next topic this page

      Set screen Run Results Files

      By default, VuGen creates a new user named after the current user name. For example, a user named "Tester" will have run results under the C:\Documents and Settings\ folder for a user named Tester.LOADTEST. VuGen automatically sets the Windows environment variable TEMP to %USERPROFILE%\Local Settings\Temp so that results are written to that user's sub folder \Local Settings\Temp. The full path for user Tester would be

        C:\Documents and Settings\Tester.LOADTEST\Local Settings\Temp

      Results from each LR run is stored in its own folder under the "Results" folder.

      • When the Controller's Result Settings are changed, an .lrr (LoadRunner Results) file is created in the directory specified in File > Save. Within this file's [Data Collection] section, FullData=1 enables viewing of whatever data was saved. If this value is FullData=0 LR will not look for run results.

        When the scenario is started, it is updated with a start time in UNIX date formatanother page on this site, such as:

          [Scenario]
          Start_time=1018300521

      • In the Controller machine's Results folder specified for a run, the remote_results.txt (ASCII) text file lists the file path to the events (.eve) file automatically generated for each host name (ip address). Example:
          [Hosts]
          10.0.95.109=d:\temp\brr_BGf.453\netdir\d\ecom\ecom1_s3\res3\10.0.95.109_20.eve

      • The _t_rep.eve events file contains binary Vuser and rendezvous info. There is a localhost_1.eve host event file for each agent host. Their first line contains:
          28 11 1018300521 2 4627103 22735576 5481115"

        • The 11 in the example above is the event code to start the scenario.
        • The 1018300521 is the start time (from the 1/1/1970 epoch).

        If this is not the same as the start time in the .lrr file, a "Fatal error" will occur when opening an Analysis file.

      • The vuser.cfg configuration file contain run-time settings (think time, iterations, log, web) set within VuGen.
      • The vuser.usp log file contain the script's run logic, including how actions sections run
      • The off_1.def definition file for graphs that describe online and other monitors.
      • The collate.txt file lists the paths to result and Analysis collation files.
      • The output.mdbanother page on this site output MS-Access database file created by Analysis
      • The offline.dat data file of sample monitor information.
      • The log folder contains -- when logging is enabled -- res_dir\output.txt message files generated during replay under a folder for each group which contains a folder for each Vuser in that group.
      • The sum_data folder contain graph summary .dat files.

      If the lr_end_transaction command does not use exactly the same name as its corresponding lr_start_transaction name, all subsequent actions will be under that transaction.

      If an Web SSL script works in the Controller but not vuGen, try changing the controller's Runtime Settings Preferences to "WININET replay instead of Sockets".

      To enable VuGen to record nca_java_action and other functions against Java objects, the application server needs to be configured to provide the necessary data. To do this, edit the startup HTML file that is called when the applet viewer begins. Modify the line:

      <PARAM name="serverArgs ............ fndnam=APPS"> 
      and add the Oracle key "record=names": 
      <PARAM name="serverArgs ............ fndnam=APPS record=names"> 


    Go to Top of this page.
    Previous topic this page
    Next topic this page

    Controller Scenarios

      Scenarios are specified within the Controller

      Scenario Scenarios encapsulate the Vuser Groups and scripts to be executed on load generators at run-time.

      Manual scenarios can distribute the total number of Vusers among scripts based on the analyst-specified percentage (evenly among load generators).

      Goal Oriented scenarios are automatically created based on a specified transaction response time or number of hits/transactions-per-second (TPS). Test analysts specify the % of Target among scripts.


    Go to Top of this page.
    Previous topic this page
    Next topic this page

      Run Scenario Types

      This table summarizes the typical settings for each type of run scenarioanother page on this site

      Menu Setting A. Speed B. Contention C. Overload D. Longevity
      Controller # of Iterations 1 only Several Infinite
      Run Options Frequency of output:
      Sample once every
      1 second 10 seconds 1 minute 5 minutes
      Run-time
      Settings
      Vusers 1 only max. licensed # below "knee"
      Logging For debugging No
      Think Time None Randomized Actual
      Continue on error? No Yes
      Network Speed Simulation Maximum No
      Browser (cache) emulation No Yes
      Content Checks Yes No
      Schedule Ramp-up: Load all Vusers simultaneously Yes
      Initialize Before Run? No Yes No
      - Interval (seconds) 4 >4 30 or more
      Tools > Options > Monitors Server Resource Monitors: Data Sampling Rate 3 seconds (Default) 5 minutes

      Reminder When scheduled to Run until completion, the Quantity for a Scenario is the number of vusers running one at a time.

      Reminder When scheduled to Run for a period of time, the Quantity for a Scenario is the number of vusers running simultaneously.
      The time specified begins after the Ramp Up period, when all vusers have entered Run state. This specified time plus the time it took to get all vusers into Run state becomes the total Elapsed Time of a time-limited run.

      Idea To run a specific number of vusers simultaneously, set the Parameter file in the script (in VuGen) to Abort after reaching the end of file.


    Go to Top of this page.
    Previous topic this page
    Next topic this page

      Scenario Settings

      Scenario Run Time Settings make use of Run logic scripts plus:
      • Pacing of how soon to start a new iteration (__ seconds after the previous iteration ends or at certain intervals).
      • screen captured Logging - AdvancedTraceon this page
      • Think Time
      • screen capturedMiscellaneous Continue on error? Fail open transactions on lr_error_message
      • Under Network Speed Simulation of bandwidth, selection of anything other than "Maximum available" requires a separate WAN Emulator license purchase to mimic WAN/Internet by slowing, dropping, and changing packets between client and server. With the license, you can choose custom, or these rated speeds:
        • 14.4 Kbps (Analog modem)
        • 28.8 Kbps (Analog modem)
        • 56 Kbps (Analog modem)
        • 64 Kbps (ISDN)
        • 128 Kbps (Dual ISDN)
        • 512 Kbps (DSL)
      • Browser Emulation: Simulate browser cache?
      • Internet Protocol of Proxy or use of ContentCheck application

      The Controller saves these settings in the .lrr file specified in the Results Settings dialog.


    Go to Top of this page.
    Previous topic this page
    Next topic this page

      Advanced Trace

      If Run-Time Settings has the "Advanced Trace" checkbox selected before the script is run, these lines will appear in the output log:

      UTC (GMT) start date/time  : 2005-08-02 02:31:30  	[MsgId: MMSG-26000]
      LOCAL start date/time      : 2005-08-01 21:31:30  	[MsgId: MMSG-26000]
      Local daylight-Savings-Time: Yes  	[MsgId: MMSG-26000]
      Some of the Run-Time Settings:  	[MsgId: MMSG-27142]
          Run Mode: HTML  	[MsgId: MMSG-26845]
          Download non-HTML resources: Yes  	[MsgId: MMSG-26845]
          Verification checks: No  	[MsgId: MMSG-26845]
          Simulate a new user each iteration: Yes  	[MsgId: MMSG-26845]
          Non-critical item errors as warnings: Yes  	[MsgId: MMSG-26845]
          WinInet replay instead of Sockets: No  	[MsgId: MMSG-26845]
          HTTP version: 1.1  	[MsgId: MMSG-26845]
          Keep-Alive HTTP connections: Yes  	[MsgId: MMSG-26845]
          Max self Meta refresh updates: 2  	[MsgId: MMSG-26844]
          No proxy is used (direct connection to the Internet)  	[MsgId: MMSG-27171]
          DNS caching: Yes  	[MsgId: MMSG-26845]
          Simulate browser cache: Yes  	[MsgId: MMSG-26845]
              Cache URLs requiring content (e.g., HTMLs): Yes  	[MsgId: MMSG-26845]
                  Additional URLs requiring content: None  	[MsgId: MMSG-26845]
              Check for newer versions every visit to the page: No  	[MsgId: MMSG-26845]
          Page download timeout (sec): 120  	[MsgId: MMSG-26844]
          Resource Page Timeout is a Warning: No  	[MsgId: MMSG-26845]
          ContentCheck enabled: Yes  	[MsgId: MMSG-26845]
          ContentCheck script-level file: "C:\...\LrwiAedScript.xml"  [MsgId: MMSG-26842]
          Enable Web Page Breakdown: No  	[MsgId: MMSG-26845]
          Enable connection data points: Yes  	[MsgId: MMSG-26845]
          Process socket after reschedule: Yes  	[MsgId: MMSG-26845]
          Snapshot on error: No  	[MsgId: MMSG-26845]
          Define each step as a transaction: No  	[MsgId: MMSG-26845]
          Read beyond Content-Length: No  	[MsgId: MMSG-26845]
          Parse HTML Content-Type: TEXT  	[MsgId: MMSG-26845]
          Graph hits per second and HTTP status codes: Yes  	[MsgId: MMSG-26845]
          Graph response bytes per second: Yes  	[MsgId: MMSG-26845]
          Graph pages per second: No  	[MsgId: MMSG-26845]
          Web recorder version ID: 5  	[MsgId: MMSG-26844]
      

      "[MsgId: MMSG-26842]" in LR 8.0 was "[MsgId: MMSG-26844]" in LR 7.8
      "[MsgId: MMSG-26844]" in LR 8.0 was "[MsgId: MMSG-26846]" in LR 7.8
      "[MsgId: MMSG-26845]" in LR 8.0 was "[MsgId: MMSG-26847]" in LR 7.8


    Go to Top of this page.
    Previous topic this page
    Next topic this page

      Log Files

      One of the most common headaches with load testing is running of hard disk space during a long run.

      Idea If a transaction fails, search the load generator machine for log files containing text such as

        xxx" ended with "Fail"

        where xxx is the last few characters of the transaction name.

      LR vuGen stores logs (for a "null" user) in the "output.txt" file.

      LR Controller stores logs for each vuser within a folder hierarchy:


        starting from the folder specified when defining Generators.
        Then under that folder the Generator creates folders with a random name such as "brr_rf2.63".
        Under each of those folders is a netdir folder which contains the folder specified for Results within the Controller.
        A separate file is create for each group.vuser number.

      • Search and Replace and other such utility can be used to search across several log files for a particular text such as "error -".


    Go to Top of this page.
    Previous topic this page
    Next topic this page

      Controller Schedules

      One minor irritation with the Schedule UI is that different words are used for selections are summarized. Ramp down is not shown at all on the summary page.

      Groups exists with a scenario. So "Scenario Scheduling" involves changing settings for all groups.

      Mode: Scenario Duration: Load Behavior:
      Scenario Scheduling
      __ Schedule by Scenario:
      Within Duration tab:
      __ Run Until Completion

      __ Run for ________ HH:MM:SS
      __ Run indefinitely (forever)

      Within Ramp Up tab:
      __ Load all Vusers simultaneously (default)
      __ Start __ Vusers every ___ HH:MM:SS
      Within Ramp Down tab (if Run for limited duration):
      __ Stop all Vusers simultaneously
      __ Stop __ Vusers every ___ HH:MM:SS
      Group Scheduling
      __ Schedule by Group
      (for each script):
      Unknown duration Defined per scenario group

      __ Initialize all Vusers before Run?

      Idea One way to determine appropriate ramp up time to specify is to set vusers to start simultaneously, then look at the resulting rate Running Vusers drop off after processing (such as 10 users within a 15 second span).


    Go to Top of this page.
    Previous topic this page
    Next topic this page

      Set screen Controller Online Graphs

      Idea LR allows up to 16 graphs to display in the Run tab. I like to use all 16 of them with metrics in this arrangement:

      Transactions Secondary System Resources
      Runtime: Running Vusers
      + # Connections
      Error Statistics UNIX Load Avg Win Threads
      Transaction: Response Time (sec) - UNIX CPU Util Win CPU Util
      Total Trans/Sec per Second Hits + Pages Downloaded + Connections + SSL UNIX Paging -
      Throughput (bytes) Network Delay UNIX Disk Traffic -

      Set screen Merging Graphs

      Idea In both the Run chart and Analysis graphs, I prefer to merge into a single graph "Response Time" and "Running Vusers" and/or "Number of Connections".

      These are usually the most important relationships under study.

      Set screen Per Second Graphs

      I also merge "Per Second" metrics together on one graph:

      • "Hits per Second" — the number of hits on the Web server (y-axis) as a function of the elapsed time in the scenario (x-axis). This graph can display the whole scenario, or the last 60, 180, 600 or 3600 seconds. You can compare this graph to the Transaction Response Time graph to see how the number of hits affects transaction performance.
      • "HTTP Responses per Second" — the number of HTTP status codes, which indicate the status of HTTP requests, for example, "the request was successful," "the page was not found" returned from the Web server during each second of the scenario run (x-axis), grouped by status code.
      • "Pages Downloaded per Second" from the server during each second of the scenario run. This graph helps you evaluate the amount of load Vusers generate, in terms of the number of pages downloaded. Like throughput, downloaded pages per second is a representation of the amount of data that the Vusers received from the server at any given second.
      • "Pages Downloaded per Second" from the server during each second of the scenario run. This graph helps you evaluate the amount of load Vusers generate, in terms of the number of pages downloaded. Like throughput, downloaded pages per second is a representation of the amount of data that the Vusers received from the server at any given second.
      • Total Transaction per Second (Passed)
      • Total Transaction per Second (Failed)
      • Connections + SSL

      Reminder LR does not remember most scenario graph settings (4 graphs is the hard coded default). So instead of building graphs from scratch, I start from opening and then changing my custom but standard scenario file.

      Reminder Delete graph definitions you don't need to ever see. LR collects data for graphs even if it is not displayed.

      By default, the Controller online monitor shows a maximum of 20 measurements for each graph. To increase it, go to the LoadRunner\dat\online_graphs directory to modify the value of MaxDispMeasurments= in the file controlling each type of graph:

        Description File Name
        All generalsettings.ini
        System Resource Graphs online_resource_graphs.rmd
        Runtime Graphs online_runtime_graphs.def
        Transaction Graphs online_transaction_graphs.def
        Web Resource Graphs online_web_graphs.def
        Streaming Media online_web_graphs_mms.def

      Default counters for the System Resource, Microsoft IIS, Microsoft ASP, or SQL Server monitors are defined in the res_mon.dft file within the LoadRunner/dat folder. Its values can be pasted from the [MonItemPlus] section within scenario .lrs files.

      Remember UNIX Resources and some other graphs are continuously updated even after the test is done. So immediately after the scenario runs, right-click on the graph to freeze the values displayed to lock in values associated with other graphs.

      Installation tip: If the Web Resource Graph is blank, try re-registering .dll files by running MS-DOS Batch Files register_controller.bat and set_mon.bat in the LoadRunner\bin folder.

      Reminder Actions are executed sequentially in the order shown in Run-time Settings. However, transactions that start and stop between two observations will appear to be running simultaneously even if they were actually executed sequentially. An observation interval of 4 seconds is the most often that you can set for Controller on-line graph (to prevent too much CPU-intensive graphic refresh time from consuming the Controller machine). But Analysis reports will show more granularity than on-line graphs — down to 1 second.


    Go to Top of this page.
    Previous topic this page
    Next topic this page

    Set screen Protocol Graphs & Script Prefixes


    Go to Top of this page.
    Previous topic this page
    Next topic this page

    Set screen Transactional Web Request Counters

      Service Summary Counter Components
      ASP
      Requests
      Volume:
    • Total count of requests spanning the elapsed time (T) over an entire run
    • Not Found
    • Rejected
    • Errors
    • (Accepted & Completed)
      Pipeline Queue Length:
    • Current (instantaneous count of) Requests
    • Queued (waiting)
    • Executing
    • Residence Time seconds transactions spend at the server Wait time
      Service time
      Utilization percentage the server provides services Waiting
      Busy
      Throughput Rate of completions per second
    • Requests/sec
    • Transactions/sec
    • Errors/sec
    • (valid/sec.)
      It can be confusing to look down a list of counters. So I developed this table to visualize the difference among counters for a single service. Counters for the ASP service is typical of all other counters its aspects: Volume, Pipeline Queue Length, and Throughput Rate of completion.

      Reminder Component counters on the right column should total to the value of the summary counter on the left. A total counter is broken down into detail counters.

      Metrics in parentheses, such as (Accepted), are not collected by the system because they are assumed and can be derived by subtracting from the total all other related counters.

      ASP metrics does not include Residence time (the sum of Wait time and Service time) and Utilization.

      toolThe $800 SPECweb99 (v1.0 announced 1999) and SPECweb99_SSL (March 2002) pre-defined workload generators benchmark the number of WWW server connections per second specific hardware configurations can sustain require a sustained throughput of 400 and 320 Kbps in order for its measurements to be considered conforming.

      An Analysis of Web Server Performance" http://www.research.ibm.com/people/i/iyengar/ton04.pdf by IBM Master Inventor Arun Iyengar

      The free Mindcraft WebStone 2.5 benchmark improves on the 1995 version originally from Silicon Graphics by also simulating the activity of 100's of web clients on a computer making GET calls to CGI and server API as well as static HTML pages. Its run rules currently does not support POST, SSL, Authentication, HTTP 1.1, HTTP 1.0 keep-alives, Cookies, dynamic workloads with database access.

      webpage article Sample Test Results of runs using tool Web Server Stress Tool from network monitoring company Paessler

      tool Web Performance

      The TPC (Transaction Performance Council's) TPC-W Web eCommerceanother page on this site benchmark (first announced July 2000 & with v1.8 published Feb 2002) measures the number of Web Interactions processed Per Second (WIPS) from a "Web Interaction Mix" of Shopping (WIPS), browsing (WIPSb) and ordering (WIPSo) transactions simulating a retail bookstore with 14 web pages, including shopping cart functionality. The top audited price/performance result on 01/28/02 is a TCO-based range of US$24.50 - $277.08/WIPS using IIS5 & SQL2000 within Windows 20003AS on a Dell server. Audited performance characteristics are detailed by web server, web cache, database server, and image server. The benchmark measures scalability by providing a Remote Browser Emulator (RBE) executable that (without client caching) simulates 2880 different users accessing databases at various scales (10,000 or 100,000, etc. unique product items within a schema of 8 tables) on database servers with 2 to 4 gigabytes of memory (with a 30 second non-SSL cache time-out). So TPC-W requires a network topology that supports several 100 Mbytes/sec of data. User think time is based upon a distribution with an average of 7 seconds and a maximum of 70 seconds. Article by Wayne D. Smith, Intel Corporation


    Go to Top of this page.
    Previous topic this page
    Next topic this page

      Set screen Web (Apache/IIS) Monitors

      Apache web servers provide a much small number of monitors than Microsoft IIS

      1. #Busy Servers - Number of servers in the busy state.
      2. #Idle Servers - Number of servers in the idle state.
      3. Apache CPU Usage - Percentage of time the CPU is utilized by the Apache server.
      4. Hits/Sec - The HTTP request rate.
      5. KBytes Sent/Sec - The rate at which data bytes are sent from the Web server.

      Loadrunner obtains values for these counters from issuing http://server /server-status?auto

      The number and description of Apache counters are specified in LoadRunner's \dat\monitors\apache.cfg file.

      • Counters= specifies the number of counters (5 by default).
      • Counter1= specifies the name of the counter as it appears in the HTML page returned from the server. If this is mispelled, LoadRunner will issue "Monitor name :Apache. Parsing error, cannot find token..."
      • Label1= The counter UI label.
      • Description1= for the counter.
      • KeepPrevValue1=0 shows the value as is, 1 shows the rate.

      This file should be replaced with apache_2.0.x.cfg if you are using Apache v2.


    Go to Top of this page.
    Previous topic this page
    Next topic this page

    Set screen Transaction Response Times

    • End-to-end GUI response time is the total elasped "round-trip" time from when a user initiates action (such as clicking a submit button on a web browser) -- plus time for going through the network and for Middleware (such as IBM Websphere MQ or Tuxedo 6/7) and server processing -- to when a response from the web server is completely received and the user can act on the server's response:

      A. GUI Client
      API
      B. External
      Internet
      WAN
      C. Front-facing
      Web
      servers
      D. Internet
      Firewalls
      & routers
      E. Load
      balancers
      F. Middleware
      (App servers)
      G. Database
      Server

      Web architecture
      To identify bottlenecks, more granular transaction metrics are needed:

      • Network and Server response times are measured by running non-GUI Vusers on the client machine.

      • GUI file download response times are calculated by comparing GUI end-to-end times vs. Non-GUI total times.

      • GUI client display (paint) times are obtained manually (with a stopwatch).

      • Middleware to Server response times are obtained only by running Vusers issuing the separately licensed middleware API to the app server.

      • Individual server response time are obtained by running Vusers on a machine directly connected to the app server (not just on the same subnet together).

      Difference in Transaction Time from several runs allow different loads to be compared in a Transaction Analysis graph.

      Each transaction measure performance of one or more action steps. [Workbook 3-17]

      In Transaction Performance graphs, "Top time" transaction results point to bottlenecks in the system in that they, irrespective of system load -- require significantly more than the average time to complete.

      Ramp-up and ramp-down by the Scheduler affect this.


    Go to Top of this page.
    Previous topic this page
    Next topic this page

    Set screen Web Page Breakdown

      The Transactions Per Second (passed and failed) and Transaction Response Time obtained from user-defined data points from Virtual Users are detailed by Web Page Breakdown Graphs which break down Virtual Users' client-side transaction times obtained from Web Server Resource Monitors.

      Reminder Web Page Breakdown graphs are available in Analysis only if before the run, in LR Controller Diagnostics menu Distribution... dialog, BOTH the "Enable the following diagnostics" and the "Web page Diagnostics" checkbox are checked.
      AND they are added in the Analysis program.

      This explains the default order of Page Download Time Breakdown graph measurements:

      Protocol Metric Measurement Description Infrastructure Technologies
      HTTP/S [Client Time] the average amount of time that passes while a request is delayed on the client machine due to browser think time or other client-related delays. This does not include time for Flash to paint graphics (which takes many seconds). -
      [Connection Time] is the time needed to establish an initial connection with the Web server hosting the specified URL. This gives a good indicator of problems along the network. It also indicates whether the server is responsive to requests. -
      [DNS Resolution Time] time needed to resolve the DNS name to an IP address. If the hosts file contains the IP/host name pair under test, this should be very quick. Otherwise, the DNS server specified for the TCP/IP Properties is used. DNS Lookup measurement is a good indicator of problems in DNS resolution, or problems with the DNS server. -
      [Error Time] the average amount of time that passes from the moment an HTTP request is sent until the moment an error message (HTTP errors only) is returned -
      [First Buffer Time] time that passes between when the initial HTTP GET/PUT request until the first buffer (8K large) is successfully received back from the Web server. This measurement is a good indicator of Web server delay as well as network latency. (Time to First Buffer) -
      FTP [FTP Authentication time] time taken by the FTP server to authenticate the client before it starts processing the client's commands. This measurement is applicable only to communications using FTP (not HTTP/S) protocol. So HTTP transactions would always show zero (0) for this metric.
      HTTP/S [Receive Time] time that passes between when the first byte to when the last byte arrives from the server -- when downloading is considered complete. The Receive measurement is a good indicator of network quality look at the time/size ratio to calculate receive rate). This is the metric reported by LoadRunner function

      longLastByteMSecs=web_get_int_property( HTTP_INFO_DOWNLOAD_TIME );
      
      HTTPS [SSL Handshaking Time] time taken to establish a Secure Socket Layer connection (includes the client hello, server hello, client public key transfer, server certificate transfer, and other stages).
      If this value is high during high load, the web server may benefit from additional technologies such as an encryption daughter board on the web server or a load balancer deviceanother page on this site that also performs SSL encryption.

      Time to First Buffer Breakdown (Over Time) Graph

      The Time to First Buffer Breakdown (Over Time) graph separates server- or network-related time (in seconds).

      Each column represents a different hit (resource). The Average and Maximum


    Go to Top of this page.
    Previous topic this page
    Next topic this page

      Set screen LRAnalysis70.ini

      The Analysis module reads and saves its setting in the LRAnalysis70.ini file with in the Windows directory (C:\Winnt or C:\Windows on Windows XP). Caution! To enable LoadRunner 7.8 Webpage Breakdown graphs to display URLs with a length greater than 25 characters, add a SURLSize entry in the [WPB] section to specify 255 (the maximum):

        [WPB]
        SURLSize=255

      Also, in the LoadRunner\bin\dat directory, use MS Access 2000 to open loader2.mdb or use MS Access 97 to open loader.mdb. Highlight the Breakdown_map table, select design view, and change the "Event Name" column size to 255.

      Set screen Web Server Resource Monitors (Virtual Users):

      The First Buffer Breakdown graph also displays Server and Network time of each Web page component's relative server and network time (in seconds) for the period of time until the first buffer is successfully received back from the Web server. If the download time for a component is high, this graph can be used to determine whether the problem is server- or network- related.

      The Throughput graph shows the amount of throughput on the Web server (y axis) during each second of the scenario run (x axis).

      The Hits Per Second graph shows the number of hits on the Web server (y axis) as a function of the elapsed time in the scenario (x axis).


    Go to Top of this page.
    Previous topic this page
    Next topic this page

    Set screen Measurement Calculations

      The less time per transaction, the greater a system's throughput, as expressed by the formula derived from Little's Law:

        Server Thruput = # of real simultaneous users / ( Average Response Time + Think Time )

      So when no think time is used, the number of virtual users can be calculated by this formula suggested by Menasce & Almeida:

        # of real simultaneous users * [ Response Time / ( Response Time + Think Time ) ]

      For example, to simulate 1,000 real users using 2 second response time and 20 second think times:

        1,000 x [ 2 / ( 2 + 20 ) ] = 91


    Go to Top of this page.
    Previous topic this page
    Next topic this page

      Set screen Surface Chart

      The formula above can be illustrated with this surface chart created usng Microsoft Office Excel 2003.

      The red cirles on this graph helps you visualize that the throughput rate of 20 TPS (Transactions Per Second) can be achieved by several combinations of Vusers (load generation worker threads) and think times between each transaction.

      • On the left, 1000 workers issuing a request every 50 seconds.
      • On the right, 100 workers issuing a request every 5 seconds.
      • In the middle, 200 workers issuing a request every 10 seconds.

      Each of these combinations achieves 20 TPS.


    Go to Top of this page.
    Previous topic this page
    Next topic this page

    Set screen Errors

      Caution! If you define a transaction within another transaction, an error will be counted twice in the Controller Scenario Status Failed Transactions statistic, one under each transaction summary.

      System Load

      is measured by a rate -- the total number of tasks performed during a certain period (an hour, day, week, month, quarter, year, etc.). Example: 300 transactions per second.

      There can be several levels of load:

      • Peak number per hour or per second is typically used for system sizing.
      • Normal load levels are used to plan on-going support requirements.
      • Low load levels are used to plan the percentage of resources which can be taken off-line for repairs and upgrades.

      Task Distribution Profiles

      present a two-dimensional view of the number of tasks performed over continuous segments on a timeline.

      A prioritization of metrics (Crucial, Primary, Minor) on the List of Monitoring Environments

      A Risk Profile may also include an estimation of risk of malfunction and likelihood of impact to the business.


    Go to Top of this page.
    Previous topic this page
    Next topic this page

    Set screen Measures of Variation

      The average measures the central tendency in a group of numbers. For example, the average of 10, 20, and 30 is 20 . This is calculated by adding all three numbers together (10 + 20 + 30 = 60) and dividing this sum by the number of items added together (in this example, three).

      Standard Deviation

      Standard deviation is a statistical measure of the extent of variation in a set of data. The standard deviation tells you the extent of the spread of individual items around the average.

      The number in the 90% column is shown after a run is completed in the Analysis program, not in the Controller) because it is calculated by sorting all items by value obtained during the run, then identifying the value associated the item at the top 10% of all items.

      Idea The CV (Coefficient of Variation) makes the standard deviation number easier to comprehend by representing it as a multiple of the average.

      Statistical Significance

      Measures of variation are necessary to determine whether two averages are different enough to not have occured by mere chance. Results need to be standardized to a standard distribution in order to determine the extent of random chance. This is a mathematical technique called ANOVA (ANalysis of Variance), an extension of the t-Test to an arbitrary number of factors and levels. The shape of the standard distribution could be bell-shaped normal distribution or an exponential gamma distribution.

      If one average is larger than the 90% number of another average, there is a good chance are that there is a significant difference between the two averages.

      But a statistically significant effect is not necessarily practically significant.


    Go to Top of this page.
    Previous topic this page
    Next topic this page

    Set screen Using the Analysis Module

      Do this! By default, the Analysis Summary is filtered to include think times. This is useful for capacity runs. But if you're aiming to know how long the server took to respond, you must click the global filter tunnel icon, scroll down to the "Think Time" Filter condition and uncheck the box.

      Do this after each run until LoadRunner developers give us a toggle that does it for us (which would save those of us on the ground doing the work a lot of time)

      Reminder Merged Graphs defined in the Controller are not carried over to Analysis. So you have to recreate them.

      To combine/merge graphs such as "Running Vusers" and "Transaction Response time":

      1. Select "Overlay Graphs" or...
        In the Analysis tool, mouse over the "Running Vusers" graph and right-click (for the vertical X-axis).
      2. Select "Merge Graphs".
      3. For the 'graph to merge with', select "Average Transaction Response Time" (for the horizontal Y-axis).
      4. Check the radio button for "Correlate".

      Popular reasons for duplicating a [Whole Run] graph are listed below.

      • [initial] - the ramp-up period, good for identifying limits.
      • [cap] - Limits outlyers so less relatively less volatile measures are more apparent.
      • [flat] - after the ramp-up period.

      Idea I like to erase the default name "Copy of ..." and at the end of the graph name add a marker such as the words in brackets above. This is so that similar graphs remain vertically aligned.
      Are there others?

      The Analysis Module can cross-result native Windows NT/200X Perfmon statisticsanother page on this site within graphs of LoadRunner output.

      webpage article HTTP Status Codes (W3C.org's detailed explanation)

      Reminder Colors are selected by Analysis pretty much at random — so (annoyingly) the same color can be used for two different lines on the same graph. [you would think it should be smarter than that]

      Idea Since you have to manually assign colors anyway, consider using a standard set of basic colors for major metrics:
      Major Metric color
      Running Vusers beige upper left corner
      Average Transaction Time green
      Data Throughput purple
      Transactions Per Second blue

      Caution! Excel files generated with the HTML report are scaled. So either change all scale to 1 before creating the HTML report, or multiply the numbers in the spreadsheet.

      Set screen Importing External Data for Analysis

      To import data from other monitoring applications into LoadRunner Analysis for statistical calculation, graphing, and auto-correlation with stats LoadRunner Controller collects:

      1. Open an Analysis result file.
      2. Select Tools -> External Monitors -> Import Data.
      3. Select the format, date, time, then click "Next". (Supported file formats are .csv, .xls, or .log) Defined your own data format of an import file.
        • NT Performance Monitor (*.csv)
        • Win 2K Performance Monitor (*.csv)
        • Standard Comma Separated file (*.csv)
        • Standard Microsft Excel file (*.xls)
        • Master-Detail Standard Comma Separated file (*.csv)
        • Master-Detail Microsoft Excel files (*.xls)
        • <Custom File Format>
          • Selecting this would create a "New Format Name".
      4. Click "Add file".
      5. Click "OK" to add the monitor.
      6. Click Tools > "Export Custom Graphs Settings..." to store the format in a *.axm file so that the format can be reused after the current session. They contain the name of the monitor and information about the X-axis and Y-axis.


    • The output.mdbanother page on this site output MS-Access database file created by Analysis


    Go to Top of this page.
    Previous topic this page
    Next topic this page

    Set screen IP Spoofing

      When testing using Web and WinSocket protocols, by default Vusers on each host machine use the host's (agent's) IP address. Since a particular server keeps serving a specific IP address, load tests would reflect network router caching and other optimizations rather than the real-life situation where different users arrive to the server with different IP addresses. This is especially needed when the hardware configuration under test balances load across a "farm" of several (web or database) servers. "IP spoofing" enables each host machine to "spoof" the server into thinking it is using many different IP addresses.

      First, internal IP addresses (such as 192.168.1.1) may need to be allocated by the organization's Network Administrator unless you're working in a closed network.

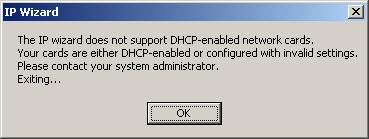
      The IP Wizard program (ipwizard.exe in LR bin) is used to define multiple IP addresses on each load generator host. However, the hosts must use static IP addresses rather than DHCP to dynamically assign addresses.

      Note: IP addresses include two components, a netid and hostid. The submask determines where the netid portion of the address stops and where the hostid begins.

      When a host machine is re-started, routing tables are updated with the new addresses.

      The IP Wizard program creates a batch file (nt_routing.bat for Windows and unix_routing.bat for UNIX machines) and .ips file which updates IP tables.

      To enable multiple IP Addressing At the LoadRunner Controller, pull down menu item Scenario, check "Enable IP Spoofer" (In earlier versions, "Enable Multiple IP Addresses"). This enables "Multiple IP address mode" in the Options dialog General tab, which appears after "Expert mode" is checked on the Tools drop-down menu. IP allocation should be consistent with the way users are running. If users are running as a process then the IP allocation should be done as a process, and if users are running as a thread then IP allocation should be done as a thread

      After turning IP spoofing on or off, for the setting to take effect, the Load Generator needs to be disconnected and reconnected again.


    Go to Top of this page.
    Previous topic this page
    Next topic this page

    Set screen Certification in LoadRunner

      As of July 15, 2008: HP abandoned use of the "HP Certified Professional" designation.

      To become an ASE (Accredited Systems Engineer) of HP's Performance Center v9.0, take two exams each costing $750. In Aug. 08, it is conducted once a month (on a Friday) only at HP education vendor SkyIT in New York City, NY 10001 (2 Blocks S. of PENN Station) 330 7th Avenue, 12th Floor. Phone: 866.641.6017, (919) 544-2354 Email: training@skyitgroup.com, tcook@skyitgroup.com

      You are given 3 hourse to answer 70% of 60 multi-choice questions.

      As of September 1, 2008, HP no longer recognizes Mercury's CPC (Certified Product Consultant) certification, which cost $2,500 and took 8 hours at a Mercury office. (about 5+ hrs of programming and 3+ hrs of questions, at your own discretion). So if you devote a steady 8 solid hours of study each week, you'll need (36/8) 5 weeks.


    Go to Top of this page.
    Previous topic this page
    Next topic this page

    Set screen User Hangouts

      Before allowing you into their product support pagesA website external to this site or receive your calls at 408.822-5400 (press 1 for support, then 3 for LoadRunner) HP Mercury Software Support requires that you provide your “SAID (Software ID). Mercury's Maintenance Number(MPN) is no longer used. This number is stored in the "LoadRunner_SerialNumber" entry in the mercury.ini file created during installation within C:\WINNT.

      This is, in effect, is the extreme opposite of the open-source paradigm.

      Surgient Virtual QA/Test Lab Management System (VQMS) HP Software Customer Connection portal to HP Software Universe user convention and Vivit user group events.

      Loadrunner Yahoo Group has amassed over 10,000 messages since 1999.

      The LoadRunner forum on QAForums.com -- moderated by Ilia and Jeff Nyman (of GlobalTester.com). -- uses a feature-rich system to host an active community on several software quality topics.

      Google group comp.software.testing has "loadrunner" threads among other topics. I have written to Google about splitting it up.

      The TCQAA Mercury Forum has had few entries, but worth an occassional look.

      blog Testing reflections blogs by Suresh Nageswaran and others.

      Mercury Interactive used to have an Academic Access Program supports schools such as Santa Clara, CA to deliver this course.


    LoadRunner competes with several other load testing products and servicesanother page on this site

    A website external to this site LoadRunner jobs aggregated by indeed.com

     
    Go to Top of this page.
    Previous topic this page
    Next topic this page

    Set screen RPM (Remote Performance Monitor)

      RPM is a set of "classic" (not .NET) Microsoft ASP pages that enables a Web browser to monitor test results from a LoadRunner Controller running on a remote machine.

      An additional license is not needed for LR 7.8, but is needed for LR 7.6.

      Mercury Knowledge Base article 22664 notes that RPM requires IIS Server 4.0 or 5.0 on Windows 2000, but NOT IIS 6.0 installed with Windows 2003 servers.

      If the Controller was installed on a Windows XP machine and the RPM server is installed on a Window 2000 Server, or Windows NT machine with IIS 4.0, the XP Controller machine's Local Security Policy "Network Security: Sharing and Security model for local accounts" should be changed from "Guest Only" to "Classic". During RPM installation:

      1. Specify a root-level folder (such as "RPM") on a data drive rather than allow RPM to be installed in the default "RPM Server" folder on the same level as LoadRunner under Program Files > Mercury Interactive.

      2. Specify the UserID and Password of the Controller machine. If you take the default MI_Viewer, another new user will be created on the RPM machine. The default password for user MI_Viewer is MIOrchid#1

      3. Go to Start -> Programs -> RPM Server -> Remote Performance Monitor User Configuration, in the "Test Configuration" section of the dialog, type in the machine name of the Controller machine and then click the "Test Machine" button.

        If you do not have Administrator rights and try to change the UserID: Admin and Password: Admin, you will see this message:

          Run-time error -2147467259 (80004005)':
          Method '~' of object '~' failed

      Caution! After the RPM Server is installed on a machine, the Controller cannot be installed on top of it. The RPM must be uninstalled before the Controller can be installed on that machine.

      In Control Panel > Administrative Tools > Internet Services Manager right-click on your IIS server for New, Web Site. In the Web Site Creation Wizard, specify name "RemoteView", then Browse to associate that name with the "WWW Pages" folder.

      To start the newly defined site, you need to restart the IIS server, then start a scenario in the Controller so that it displays monitored information. If you try to view the monitor in Internet Explorer when the Controller is not running a scenario, you will be brought back to the Login page.

      Verify the site using a browser URL http://loadclient1/RemoteView
      Default User: Admin Password: Admin
      If the response is "HTTP 401.1 - Unauthorized: Logon Failed" or "You are not authorized to view this page", use Windows Explorer and right-click on the "WWWPages" folder, Sharing tab,

      It features a not very helpful "one size fits all" error message:

        The page cannot be displayed properly , because an error occurred
        Error description:
        Either the Controller is not running or there is not an active scenario on the specified server or your RPM Server is not configured properly.

      Each remote viewer can select and customize the graphs to monitor.

      Caution! RPM times out if there is no browser activity for 20 minutes. This then requires another user login.


    LoadRunner competes with several other load testing products and servicesanother page on this site

     
    Go to Top of this page.
    Previous topic this page
    Next topic this page

    Set screen LoadRunner Consultants


    Go to Top of this page.
    Previous topic this page
    Next topic this page

    Set screen Next


    Bookmark this page:
     

    Go to Top of this page.
    Previous topic this page
    Next topic this page
    Performance Engineer Life Role Site Map Performance and Capacity Management... Syndicate this list of links:

    Feed Validity Checked RSS 2.0 XML feed
    Feed Validity Checked Atom 1.0 XML feed


    How I may help

    Send a message with your email client program


    Your rating of this page:
    Low High


    Your first name:

    Your family name:

    Your location (city, country):

    Your Email address: 

      Top of Page Go to top of page
    Previous topic this page

    Human verify:
     
    Please retype: