
 HP ALM Quality Center : How To Make It Work
This is an unabashed review of how to use HP ALM Quality Center (to version 9.2) despite annoyances.
This page is one in a series for QA Managers:
|
|
|
|
PDF: HP ALM product Data Sheet
 Video: ALM 11 Product Roadmap
presento by Raziel Tabib, HP Sr. Product Manager to Vivit, the
independent user community of HP Software & Services
Video: ALM 11 Product Roadmap
presento by Raziel Tabib, HP Sr. Product Manager to Vivit, the
independent user community of HP Software & Services
Dr. Andreas Birk, TQA SIG leader http://agileqc.net/tag/alm
Quality Center (QC for short) is a web application software product offered by the Software division of HP (Hewlett-Packard), one of the largest corporations in the world.
QC was one of several products (along with LoadRunner, WinRunner, Quick Test Pro, as well as IT governance products) HP purchased with its acquisition of Mercury Interactive in 2003.
Over time, this product's name changed from "Test Director" to Quality Center (QC) to ALM (for Application Lifecycle Management) in 2010 at QC version 11, when the product's value proposition became the management of Requirements, Test Plans, Test Execution, and Defects in a single system.
The ALM product name is a little confusing because the "ALM edition" of the ALM product replaces "Quality Center Premier Edition". QC "Enterprise" and "Starter" editions carried into ALM. Furthermore, with version 11, ALM also became the database for HP's Performance Center (PC) enterprise performance testing product.
So this article refers to "Quality Center" and ALM/QC as equivalent synonyms.
The expansiveness of the ALM/QC product line makes it popular among corporate CEOs and CIOs.
The decision to adopt ALM/QC is often made between just HP salespeople and C-level executives (CEOs and CIOs) who pitch how management can get better visibility and control into the QA department. This management-oriented "business proposition" and "payback" sounds so enticing that executives often don't feel a need to get full input from technical people or to evaluate "minor technical" details (imagine the dismissive hand waving). Why inject negativity?
This article's goal is to not to merely whine but to enable workers in the "trenches" to use QC/ALM. This article warns of potential pitfalls and ways to avoid or work around them:
For a web application running on Internet Explorer, the ALM/QC GUI is quite sophisticated: graceful timeout management, drag-and-drop, right-click context menus, pop-up dialogs with menus, column width adjustment by users, and other GUI goodness.
All this is enabled by a large set of ActiveX components loaded while it starts, like Adobe Flash web apps. So people do have to wait upon URL start-up.
The flip side is that the ActiveX libraries also enables use of a custom communication protocol which enable faster binary exchanges between client and server than whole HTML pages.
Also, pauses will occur occassionally since ALM/QC is a Java app on a server with JVM garbage collection. The ALM/QC installer comes with a default installation of JBoss. But HP has tested the app running on IBM WebSphere and Oracle WebLogic.
| Operating System | Application Server | Web Server | Database | |
|---|---|---|---|---|
| Recommended: | Windows Server 2008 (SP2) 64 bit | JBoss 5.1 | Microsoft SQL 2008 (SP1) 64-bit | |
| HP-UX 11i v3 64 bit (for now) | Oracle 10.2.0.4 | |||
| Sun Solaris 10 64 bit | WebLogic 10.3 | Apache 2.2 | ||
| Linux Red Hat 5.4 64 bit | ||||
| Also Supported: | Linux Red Hat 5.4
Linux Suse 10 64 bit | WebSphere 7.0.0.9 | IHS (IBM Apache) Server
MS IIS 7 or 6 | Oracle 11.2.0.1
MS SQL 2005 (SP3) |
Patches over time enable additional support.
ALM/QC provides a system to document traceability by establishing links between data items within a set of hierarchies describing this workflow:
Releases and cycles > Define Requirements > Plan Tests > Execute Tests > Track Defects
 To track Assigned Requirements coverage,
each requirement (product backlog item) are linked to some Release Cycle.
This may make replanning a cumbersome process.
To track Assigned Requirements coverage,
each requirement (product backlog item) are linked to some Release Cycle.
This may make replanning a cumbersome process.
Requirements are linked to a Test Set Folder containing Test Sets which in turn contain manual and/or automated tests strung together.
REMINDER: Requirements are not directly linked to Test Sets because several Test Sets can apply to a requirement, in one-to-many relationships.
Requirements can be "converted" to Tests run in the Test Lab for one-to-one test coverage linkages.
Subjects in Test Sets are copied from the Test Plan module into Tests within the Test Lab module. QC provides filtering and drag and drop GUI to do this quickly.
To avoid execution notes in Test Lab instances becoming stale, they are not automatically changed when subsequent changes occur in the Test Plan. Some keep version numbers for each Test Set and note that after creating Tests from the Test Set. But the best practice is to create in TestLab Test instances LINK-ALERTS triggered by changes in its source Test Set.
To enable calculation of executed coverage, each test run is manually created and designated with the Test Set it is based upon.
| Modules Menu | Admin. | Doc. Gen. | |
|---|---|---|---|

| 
| 
| 
|
The alphabetical list on the left (with objects in singluar form) is from the menu only admininistors use to define custom fields, which does not occur frequently. It's a good idea that administrators avoid using this as the basis for describing content in the database.
The hierarchy on the right is from TOOLS > Document Generator used to create detail reports. This is perhaps the best structure to use as a basis for defining a common vocabulary.
This matches text such as "Subject" at the top of the Test Plan component hierarchy tree. This also matches the "Test Set" at the top of the Test Lab component hierarchy tree.
Those coming from or transitioning to other systems (such as ScrumWorks or Microsoft TFS) would need to memorize equivalent terminologies. For example, ScrumWorks uses the word "Themes" within "Epics" to organize what needs to be achieved by each release.
There are several mechanisms which make entry of data less onerous.
The ALM/QC Enterprise edition and above can import
[TODO: Picture]
For example, SQL to access custom fields about defects (bugs) reference fields named BG_USER_01, etc.
Because the ALM/QC system integrates so much user functionality, the ALM/QC database is complex, with dozens of tables and indexes. So rather convulted SQL coding is sometimes necessary to produce a usable report. Below are the schema in HTML help (chm) files for various versions of QC/ALM:
![]() HP QC 9.2 quality_center_db.chm.
[After downloading, in Windows Explorer go into the Properties for the
file and unclidk the Read-Only property.
If you still have problems reading .chm files, see
this)]
HP QC 9.2 quality_center_db.chm.
[After downloading, in Windows Explorer go into the Properties for the
file and unclidk the Read-Only property.
If you still have problems reading .chm files, see
this)]
The Excel interface for importing is based on Excel column letters (A, B, C, etc.) rather than column names as in most CSV files. So here is my advice:
Product managers and testers may need a hierarchy by version and release:
Those who need to analyze items across workgroups for duplication need an "upside down" or bottom-up hierarchy:
However, work is planned by those responsible for an area of responsibility, called a System or Workstream or PlanGroup:
Measures help us approximate less tangible metrics used to imagine process changes to achieve better metric scores. For example, body temperature and body temperature trend are measures. An individual instance of a measure is a measurement. "Health" is a metric. In business, market share, profit margins, and customer satisfaction are metrics.
The most useful measures are based on workflow tasks (what people do) which serve as predictors of where time and budgets might need adjustment.
Examples of measures in ALM/QC include:
 Although Quality Center provides many reports and graphs out of the box,
some complain that they
are conceived from a too technical point of view,
providing simple counts
without personalization
to vary for each role's unique need for different fields, sorting, and filtering.
Organizations need more complex reports and graphs than QC provides by default.
Although Quality Center provides many reports and graphs out of the box,
some complain that they
are conceived from a too technical point of view,
providing simple counts
without personalization
to vary for each role's unique need for different fields, sorting, and filtering.
Organizations need more complex reports and graphs than QC provides by default.
BLAH: Those who have taken a system through implementation know that new Requirements inevitably crop up. So managers need to include quantification of "unknown unknowns" (an estimate of how much work might be added along the way), to provide information for staffing purposes.
From the point where the yellow ribbon end, follow the marker line to the left and around the corner to realize the "Planned Coverage" is 60%. Those presenting this chart need to be prepared to answer the naive but valid question of "why were only 60% planned coverage"? Many in our culture assume that 100% (or even "110%") is the usual goal. A skilled manager would ask for an analysis of the economic trade-offs between risk and work, as there may not be payoff in doing everything planned, as there is less liklihood of finding a defect per unit of testing investment.
It is a bad assumption is that whatever is planned (yellow line) "should" be executed (dark red line). Practically, however, it is often desirable to have plans for more work in case other items are blocked, which frees up time for additional work elsewhere. However, within the default ALM/QC structure, it is difficult to differentiate between items commited to be executed versus items held in reserve.
I think it is a bad management tactic to measure test lab execution on a 100% scale because we want testers to define more tests than they plan on running so that if certain items get blocked, they would have already defined additional tests to run immediately rather than just waiting around. Judging testers based on a default 100% would discourage (indeed penalize) testers for being proactively productive.
The default reports only say how many of each type of data are in the database. But missing is what number is supposed to be there (at various moments of time during the project)?
Tracking the percentage of test plans (or other items) planned versus entered in the system is where SQL and Excel come in (next section), since this is not a default part of ALM/QC.
Many don't bother with additional reports not because of the technical challenges, but because of politics. Putting out a projection would "hold their feet to the fire".
For some reason, most test managers are allowed to say that they can't predict how many defects will be produced. Unfortunately, most sales managers don't have such a luxury. Stockholders and the SEC require them to provide "guidance" each quarter.
Whether it's publicly voiced or not, organizations make some prediction about how many defects they expect in their staffing actions. If NO developer time has been allocated to analyze and fix bugs, then expect NO bugs to be found. If later there is a scamble to find time to address bugs found, then some "mismanagement" has occured.
Skill at predicting future events is a learned skill, and require insightful dialog among development and test managers, something that is lacking in many organizations.
This is why one of the Agile Manifesto items is to prefer "individuals and interactions over processes and tools".

This gap is answered by software supporting Agile approaches which produce a burn-down chart such as this for points of functionality being developed by "Pigs".
In this example (produced by Rally software), each column illustrates the count of "function points" at the end of each day. The blue column is the backlog of how many remain to do.
In organizations that practice Agile, this chart is reviewed during daily scrums facilitated by a Scrum Master.
Each column defines the work for each sprint of fixed duration (1-3 weeks each).
The starting backlog is defined for each sprint are agreed upon based on a prioritized list of functionality maintained by the Product Owner.
Prioritization of features developed within each sprint is based on estimates of business value and effort obtained during Sprint Planning workshops and Product Backlog Refinement workshops.
The diagonal line in the basic burn-down chart is labeled "ideal" because it represents ideal circumstances (not management expectations). The difference between ideal and actual progress reflect blocks the team encounters.
The rate that features are worked off is (the team's capacity of items each sprint) is called its velocity.
Agile practioners prefer the horizontal time frame (including the length of each sprint) to not change to foster learning needed to improve the accuracy of estimating skill.
ALM/QC was built to track individual tasks and the hours of work associated with each. It can also differentiate between completed (Accepted) items as green columns count versus items still to be processed as blue columns.
However, an important difference with Agile vs. traditional approaches to project management is that generalized points are used instead of absolute man-days so that estimation bias can be more easily adjusted for reality and individual bias.
Additional processing (by Rally) adjusts estimated completion dates based on Scrum estimating techniques.
Such an approach requires custom fields in the QC database.
Rally maintains this chart by establishing a two-way exchange of data with ALM/QC.
But this should be done with the understanding that there is a fundamental difference between Quality Center and Agile/Scrum in that ALM/QC forces estimates, whereas with Agile an "epic" can remain as such without being associated with a numerical budget of time.
To avoid "putting a lipstick on a pig", technologies need to focus on communities of practice.
 ScrumWorks' Enhanced Burndown chart has a more informative presentation
which differentiates "headaches" (work to remove defects)
from original effort planned.
Some may find this too sophisticated / confusing.
ScrumWorks' Enhanced Burndown chart has a more informative presentation
which differentiates "headaches" (work to remove defects)
from original effort planned.
Some may find this too sophisticated / confusing.
The length of each bar — the total effort remaining after each period — is after a push down the original effort plus a push up to work off the headaches/defects remaining. An enhancement to this are different colors to depict new headaches/defects added during the period.
The red diagonal line displays the Best Fit line depicting the average velocity of burndown. Periods of slower progress would have bars floating above the red line. Periods of greater progress would have bars below the red line.
Producing a burn-down chart does not make an organization "agile" nor does it mean management is "in control". Burn-down charts do not address management of progress in all aspects of software development.
One of the Agile Manfesto items -- "Responding to change over following a plan" -- is a massive paradigm shift with the Agile movement coming into vogue early in the 21st century.
Being Agile takes a change in mindset about responding to change through constant communication and adjustment rather than pre-planned expository and adversarial contracts. An organization does not really "get" Agile if a "Scrum Master" or supervisor writes up performance reviews on programmers based on burn-down charts or whether detailed specs were developed according to management expectations.
 Becoming Agile: ...in an imperfect world (Paperback)
(Manning Publications, June 8, 2009)
by Greg Smith, Dr. Ahmed Sidky
explains Agile from a case-study perspective
within a 9 step process for adoption of agile practices.
and presents a
Agile Measurement Index
Becoming Agile: ...in an imperfect world (Paperback)
(Manning Publications, June 8, 2009)
by Greg Smith, Dr. Ahmed Sidky
explains Agile from a case-study perspective
within a 9 step process for adoption of agile practices.
and presents a
Agile Measurement Index
Succeeding with Agile
by Mike Cohns
Download HP Agile Accelerator Basic Edition
Video: HP developers in Isreal on how they went Agile with QC
Pragmatic Agile Series, Part 2: Automated Testing by HP R&D
Craig Larman,
management and organizational-design consultant, authored:
Scaling Lean & Agile Development: Thinking & Organizational Tools,
ISBN-10: 0321480961
ISBN-13: 978-0321480965
Practices for Scaling Lean & Agile Development: Large, Multisite, & Offshore Product Development with Large-Scale Scrum
ISBN-10: 9780321636409
ISBN-13: 978-0321636409
9781895186116.gif
Managing Agile Projects
by Kevin Aguanno (ed)
(Multi-Media Publications, 2004. 420 pages)
9780521191814.jpg / gif
Agile Testing: How to Succeed in an Extreme Testing Environment
by John Watkins (of IBM)
(Cambridge University Press, 2009. 328 pages)
Presents twenty real-world case studies of practitioners using agile methods, eliciting best practices.
9781599042169.gif
Agile Software Development Quality Assurance
by Ioannis G. Stamelos and Panagiotis Sfetsos (eds)
(IGI Global, 2007. 268 pages)
Providing in-depth coverage of important concepts, issues, trends, and technologies in agile software, this guide helps researchers and practitioners avoid risks and project failures that are frequently encountered in traditional software projects.
9781584503644.gif
Integrating Agile Development in the Real World
by Peter Schuh
Charles River Media © 2005 (364 pages)
IT professionals struggle with integrating agile practices and processes into traditional project environments. This text provides programmers and managers with specific ways to implement and use agile processes in everyday software development projects.
ISBN:9780470073865
Software Development Rhythms: Harmonizing Agile Practices for Synergy
by Kim Man Lui and Keith C. C. Chan
John Wiley & Sons © 2008 (308 pages)
provides programmers with a metaphor for resolving classic software management controversies and dealing with common difficulties in agile software management.
ISBN:9780470515044
Changing Software Development: Learning to Become Agile
by Allan Kelly
John Wiley & Sons (UK) © 2008 (258 pages)
ISBN:9780735625679
Agile Portfolio Management
by Jochen Krebs
Microsoft Press © 2009 (240 pages)
Delivering practical, real-world guidance on bringing agile software development methods to your entire enterprise,
this practical guide provides specific suggestions for improving processes, developing clear roles, and making decisions.
ISBN:9780849393839
Manage Software Testing
by Peter Farrell-Vinay
(Auerbach Publications © 2008 (600 pages)
Covering all aspects of test management, this book guides you through the business and organizational issues that you are confronted with on a daily basis, and explains what you need to focus on strategically, tactically, and operationally.
The advantage is that potentially shippable product increments (pspi) are produced throughout the life of a project rather than everything in one big monolithic big bang release.
ALM/QC supports the use of continuous integration build tools -- Thoughtworks' Cruise/CruiseControl, Hudson, and commercial tools Jetbrain's TeamCity, and Microsoft's Team Foundation (TFS) Build. These plug-ins insert themselves as a build step which triggers QC Test Sets and publish build results.
Those using the ALM (Premier) Edition to use several projects at once create hub projects, which gets updated from individual projects when the Synchronizer runs. The Synchronizer works with other 3rd-party products as well.
True Agile practioners do not differentiate between testers who file bugs and developers who fix them, since both work toward the same definition of "done". Instead of QA saying "it's done when I say it's done" (after developers say they are done), an interdisciplinary team gets done faster together.
In a "hybrid" Agile world, testers are embedded among developers so issues of "testability" can be easily discussed and solved. 100% coverage is assumed with Agile. This includes testing on various browsers and against various internal conditions.
"Specialized Test Management Systems are an Agile Impediment" —Elisabeth Hendrickson, October 6th, 2009"... test automation created by a siloed QA team working in isolation to reverse-engineer existing software and automate tests against an untestable UI using proprietary tools accessible only to a few select team members is guaranteed to be incredibly expensive both to create and to maintain, and also ridiculously fragile. People still do that?! :-) No wonder "testers" get such a bad rap. Their mission is literally impossible." — Jason Huggins, April 4, 2008
The "test first" concept with Agile is that code to validate whether the code being developed works before that code is written. Thus, code is written to satisfy verifiable goals. Code to verify whether the program can catch a negative test case is written before application code to recognize the situation. This is a result of the Agile Manifesto of preferring "Working Software over comprehensive documentation".
Developers can update user stories, tasks, and defects from within their working environment (Eclipse IDE and MS Visual Studio) after installing the ALM 11 plug-in (like Resharper).
Bi-directional synchronization of requirements, epics, user stories, defects, tests, and more with CollabNet TeamForge/Eclipse is enabled by an ALM/QC integration add-on.
What testers need to know is the completeness and quality of developer builds. The frequency of broken builds is one indicator of code quality.
One of the key innovations with the SCRUM approach is that instead of single-specialists, teams focus on customer-driven features are cross-functional, multi-learning, working on cross-component features. This is a hugh change in the organizational structure mind-set needed to avoid bottlenecks and achieve large scale development quickly. This needs to be reflected in the permissions structure.
QC provides a way to limit what actions (such as add, delete. etc.) different groups can do in each project. Different permissions is a big reason for having data in different projects.
QC currently does not provide a mechanism for restricting actions on specific values within a project. Someone allowed to make deletions can delete any item within a project. A user group can be restricted from viewing defects assigned to others if the Admin. creates a defect data hiding filter with filter conditions.
QC does not come with a field that defines the owner of each item, designating the role, organizatonal group, or individual who can delete or change or edit the item. The work-around:
ALM/QC requires both a database server and installation on an application Server, not Windows XP nor Vista desktops.
ALM/QC is a complex system, with patches and scripts that can cause major problems. To learn the system, users need a project with the set of data described in HP's User Guide documentation. To to test out patches, upgrades, and to develop scripts, admistrators need a dev environment to avoid messing up the production environment.
The dev environment is in addition to production and an environment for production staging and fail-over. QC's dashboard requires yet another database.
If QC 9's built-in Version Control system was not enabled, each change in data wiped out whatever was in the database, with no hope of recovery. Restore from a complete database backup was cumbersome because it's an "or or nothing" restore.
But with ALM 11, QC has a version management system that is superior to stand-alone products for text-based source code because versioning is at the individual element level rather than entire files at a time.
The cumbersoem side of versioning is that one cannot decide on the fly to make a change. The system assumes that one can cogently describe what is to be changed before seeing that data.
Sites may still want to have a stand-by environment to handle fail-over.
ALM 11 ALM (Premium) edition enables tools for sharing and synchronizing libraries of assets among multiple projects and reports consolidating multiple projects.
In the Management module, a library contains pointers to a group of assets. It can be used to share objects across projects.
A baseline is a snapshot of assets. When a baseline is pinned to a Test Set, only tests that cover requirements in the baseline can be added to it.
As with any enterprise database, the Quality Center database must be watched to ensure that it is built with the correct number of extents from the start and that those extents are extended as planned. This is to avoid disruptions from the database crashing when it unexplectedly runs out of disk space.
To anticipate turnover in DBA staff (both temporary or otherwise), have email alerts sent to a email group of DBAs.
All this is necessary becasuse the default workflow (business process) causes more disk space to be consumed than one would assume, due to the linkages among items in Quality Center. For example, each test item must be copied to Test Lab.
This is a "poor-man's" visualization capability. The Excel graphic reports I describe on another page are based on the structure of Excel chart files below:
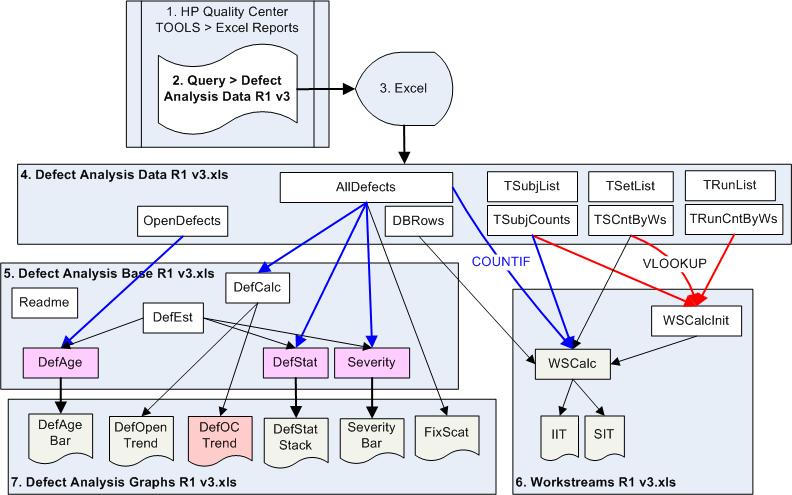
The file "Defect Analysis Data R1 v3.xls" is replaced whenever it is generated from SQL within QC.
Each tab in the SQL within QC is produced as a separate tab in the output spreadsheet.
Another spreadsheet (the Base spreadsheet) references the Data spreadsheet.
A third spreadsheet then produces charts by referencing the Base spreadsheet.
The trouble with this approach (using Excel) is that these need to be run on a specific date (e.g., every Friday at noon) so that counts at each particular point in time can be captured when it's available.
A program to generate the count of each at various points in time can be generated, but would require more complex code.
To it's credit HP does provide many ways to create custom reports. But there are so many different technologies to create reports that a manager may have to use several technologies to get a complete picture.
During my consulting engagements, I customize from working generic examples refined over several engagements.
ALM/QC needs to be considered within the total set of enterprise applications operating within most large organizations:
To get serious with managing software, ALM/QC data should be treated like other corporate metrics, and get integrated with the corporate dashboard (BI system).
Here is a flowchart of how data goes in and out of Quality Center.

Integrations needs to be considered with:
HP provides its OTA (Opent Test Architecture) API to enable VB programs to programmatically perform user actions.
It uses COM components. So connections to the database are established with Adding a defect consists of code such as this using OTA's BugFactory object
	Set tdconnection = objectHelper.CreateObject("TDApiOle80.TDConnection.1")
	Set factory = tdconnection.BugFactory
	Set Bug1 = factory.AddItem(Null)
	Bug1.Field("BG_DESCRIPTION") = "automatic created defect"
	Bug1.Status = "New"
	Bug1.Post
The above (with some code removed for clarity) is extracted from LoadRunner VB OTA scripts HP R&D created to conduct ALM 11 performance benchmarks.
As of this writing, no LinkFactory is available to create links to defects. HP Support acknowledges this.
Information on OTA and VB6 coding are below:
![]() HP ALM 11 OTA API Reference.chm
HP ALM 11 OTA API Reference.chm
OTA VB programs use Microsoft's COM interface which uses the vbrun60sp5.exe (VB6 SP5) run-time (published in 2001) rather than the newer (but much larger) Microsoft's .NET run-time. Micorosft does not plan on supporting the VB6 run-time past Windows 7.
A debugger is not provided for VBScript programs within ALM/QC, use these tools to write and debug VB OTA programs:
Related Topics:
![]() Performance Testing
Performance Testing
![]() NT Perfmon / UNIX rstatd Counters
NT Perfmon / UNIX rstatd Counters
![]() Mercury LoadRunner
Mercury LoadRunner
![]() Mercury Virtual Table Server (VTS)
Mercury Virtual Table Server (VTS)
![]() Mercury WinRunner
Mercury WinRunner
![]() Rational Robot
Rational Robot
![]() Free Training!
Free Training!
![]() Tech Support
Tech Support
|
| Your first name: Your family name: Your location (city, country): Your Email address: |
Top of Page Thank you! | |||